
Relative Performance Signals a Regime Shift
Precious Metals and Mining Stocks
Note: No tactical timing is emphasized this week. The focus remains on regime change, comparative performance, and the unwinding of multi-decade pricing distortions. We observe that all the resistance levels in his methodology as being broken recently now; with the Nasdaq being the final boss. The upside is quantified where it can be and the risk to performance vs SP 500 is known (breakout levels)
A Cross-Asset Breakout Takes Hold
In his latest 360 weekend report Michael Oliver identifies November as the decisive turning point for monetary metals, marking the resolution of a long basing phase and the beginning of a broad relative-performance breakout. The analysis stresses that this is not a narrow price phenomenon, but a structural change observable across multiple equity benchmarks.
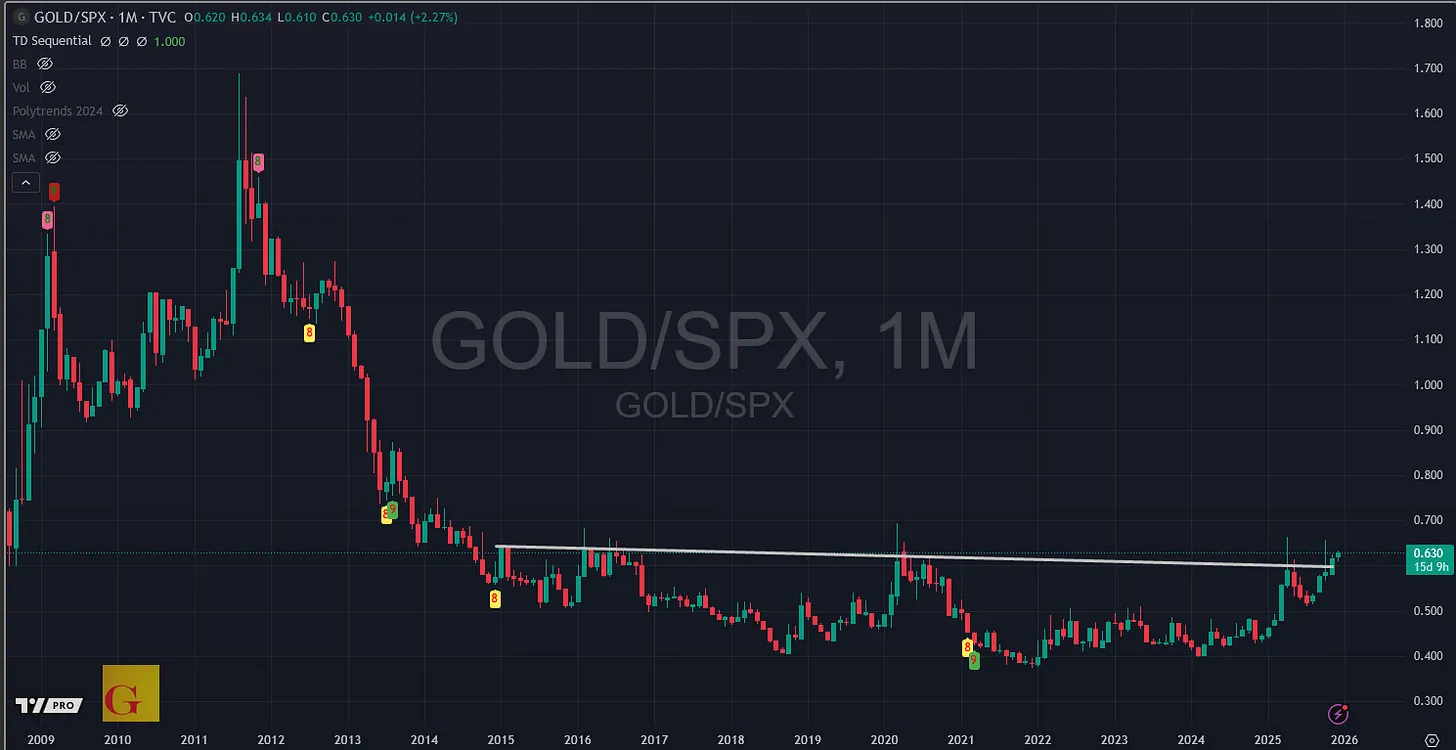
Gold has now broken out of multi-year relative bases versus the Dow Jones Industrial Average, the NYSE Composite, the S&P 500, and, most recently, the NASDAQ 100. These developments follow earlier downtrend resolutions, indicating a staggered but coherent transition in leadership.
“While all eyes and cheers are still for the stock market, the monetary metals have just signaled that the bigger game has only just begun.”
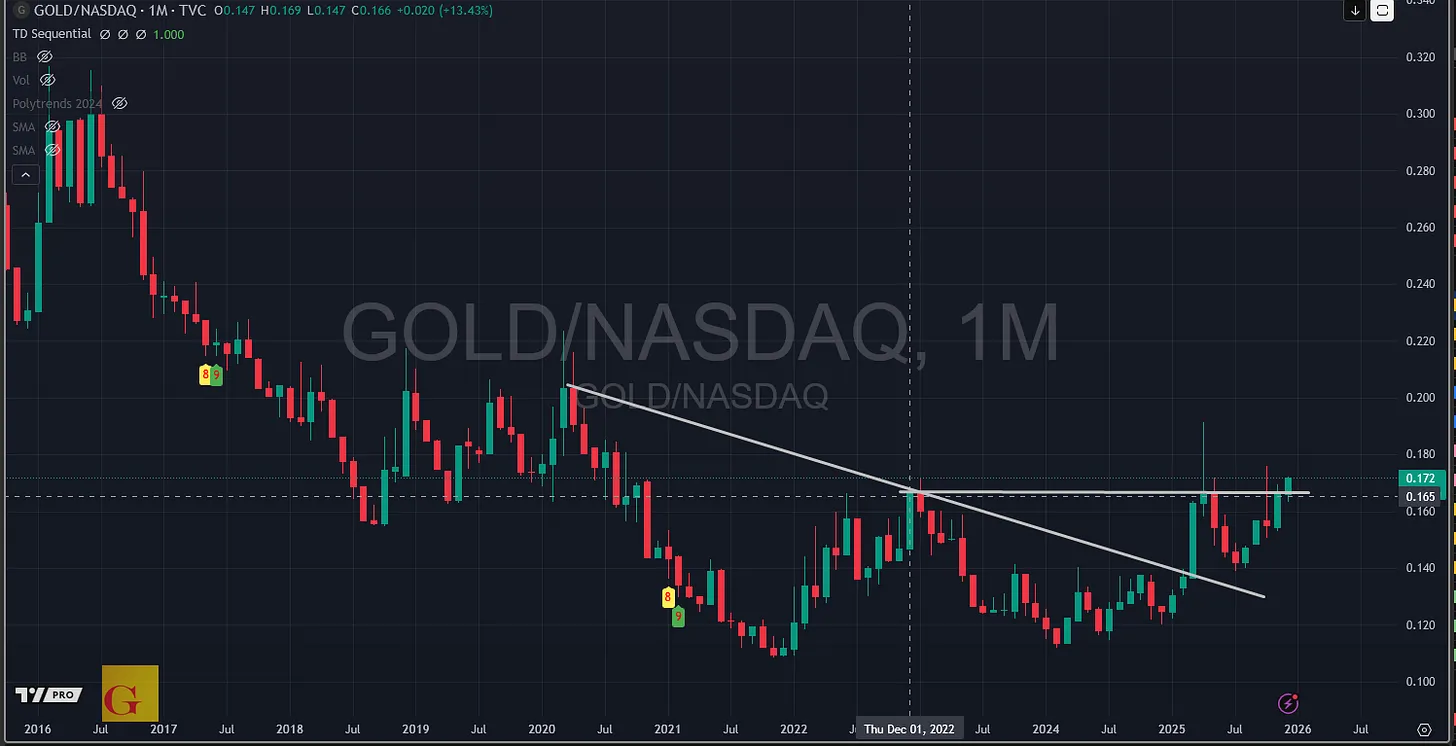
Gold vs. NASDAQ 100 monthly relative-performance spread (2013–2025), showing clearance of long-term resistance.
Gold Viewed Through a Long-Cycle Lens
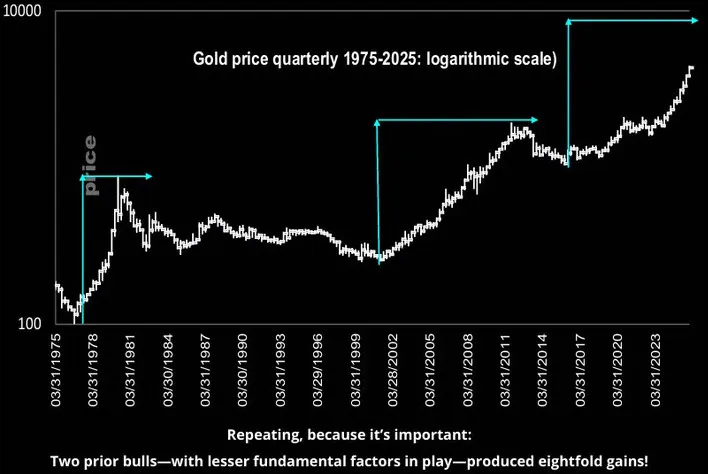
The analyst situates the current gold advance within a multi-decade framework, noting that prior secular bull markets, despite weaker supporting fundamentals, produced gains on the order of eightfold from bear-market lows. By comparison, the present cycle remains smaller in proportional terms.
MSA contrasts gold’s long-term performance with fiat currency expansion and equity returns. Over the past twenty-five years, broad equity indices have largely tracked monetary debasement, while gold has materially exceeded it. In this framing, fiat currencies are treated as unstable units of account rather than reliable benchmarks.
“A fiat currency—whether it be the Dollar, Euro, Yen, or Pound—is a laughable yardstick.”
The analysis emphasizes that U.S. investor participation remains limited, a condition Michael associates with the early to middle stages of secular advances rather than mature tops.
Silver and the Mechanics of Upside Acceleration
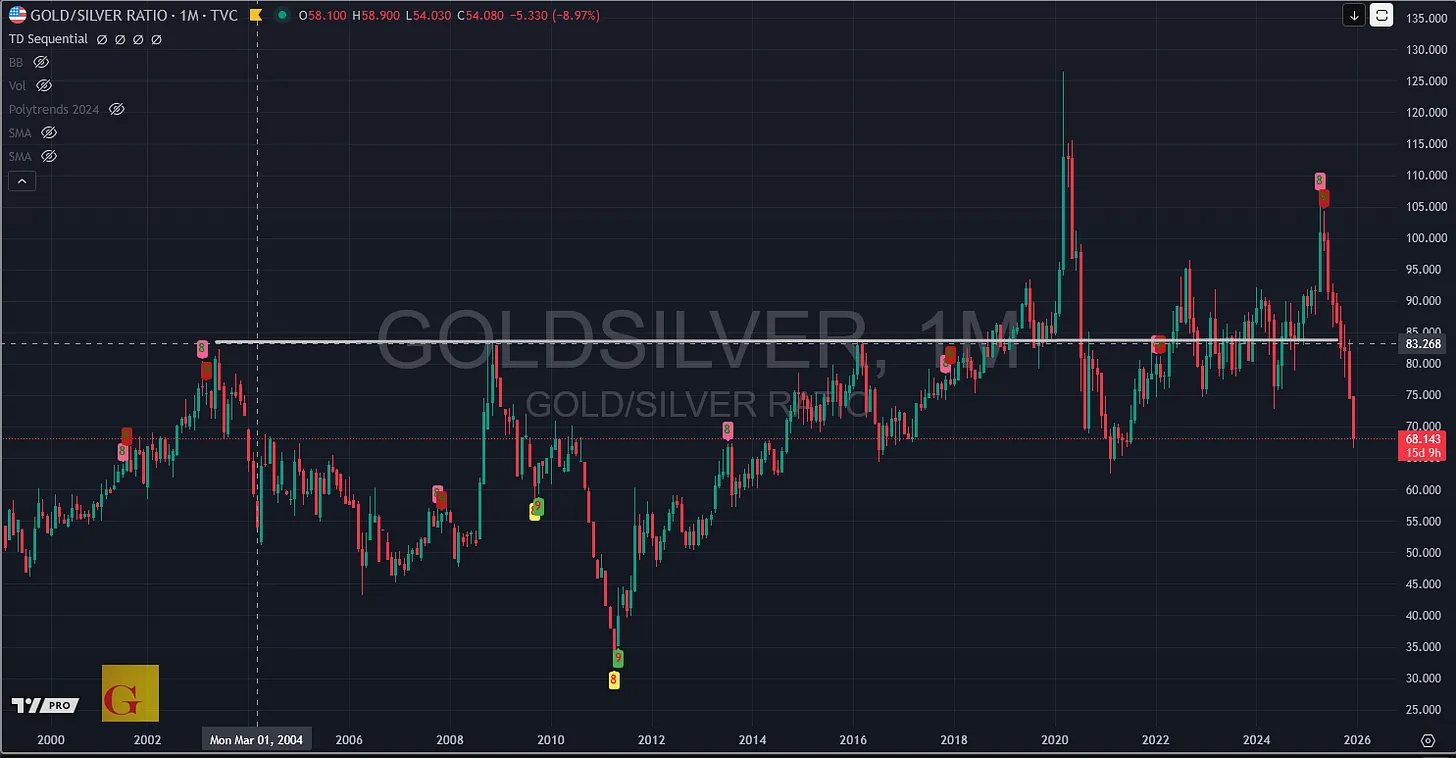
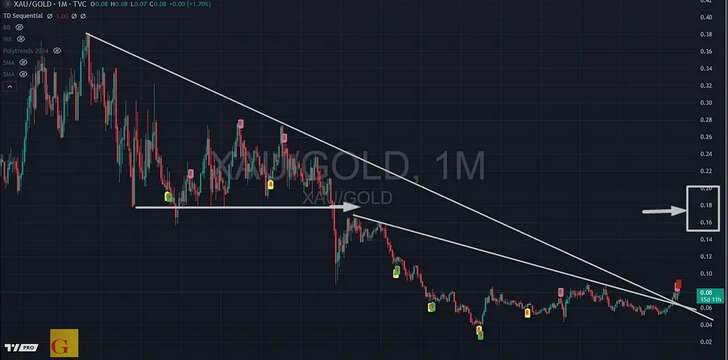
Silver is assessed primarily through its relative performance against gold. The report highlights two historical episodes, late 1979 to early 1980 and 2010 to 2011, in which silver’s explosive advances were preceded by decisive silver-to-gold spread breakouts.
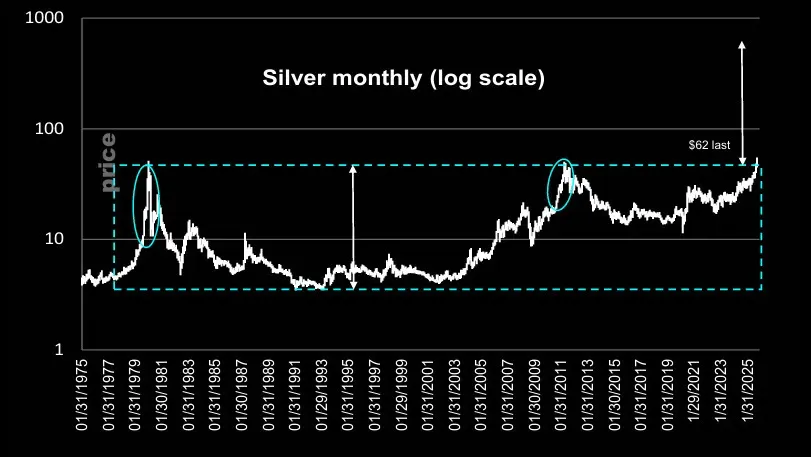
Log Cup-Handle Measured Move of the 50 Year Silver Chart is quite impressive
At the November close, silver broke out of a multi-year relative-performance base versus gold. According to the analysis, this event signals the onset of a major rediscovery phase. Prior analogs produced price moves ranging from more than a doubling to several multiples over compressed timeframes.
“For MSA that signaled the start of a massive upside ‘rediscovery’ move.”
Michael further examines silver’s half-century price confinement, applying measured-move logic to that range. While acknowledging uncertainty around magnitude, the analyst frames the potential upside as structurally consistent with past regime shifts.
Silver vs. gold relative-performance spread, multi-decade view
Mining Equities and Historical Stress Events
The report revisits prior equity-market stress episodes, particularly 2008, to evaluate how mining equities behave relative to gold during systemic selloffs. While gold experienced a sharp but brief decline in October 2008, miners suffered significantly deeper and more prolonged losses.
MSA attributes this divergence to a structural collapse in the XAU-to-gold relative-performance range. A multi-decade valuation band was decisively violated, initiating years of underperformance that persisted until late 2015.
“That was a massive negative signal for miners relative to gold.”
Since that low, the analyst identifies a prolonged basing process at historically depressed relative valuations, characterizing it as a pricing anomaly rather than a fundamental impairment.
XAU Index vs. gold monthly relative-performance spread (1984–2025), showing 2008 breakdown and subsequent base.
Miners Versus Gold and the Broader Market
More recent data show mining equities mounting a renewed assault on long-standing resistance levels versus gold. A downtrend extending back to the early 2010s has already been cleared, and the spread is approaching levels that would imply a full regime reversal.
Parallel analysis of miners relative to the S&P 500 reveals that, despite prevailing perceptions, the sector has been broadly par with the broader market over the past decade. The current breakout attempt suggests a shift away from that equilibrium.
“This time the miners aren’t in a pending weak position vs. gold or the stock market. Entirely the opposite.”
The analysis concludes that, based on relative-performance structure rather than short-term price volatility, mining equities are positioned to outperform both gold and general equities, independent of broader stock-market direction.
Bottom Lines:
Across gold, silver, and mining equities, the report consistently prioritizes relative-performance signals as evidence of a structural transition. Michael frames the current environment as one in which leadership is shifting away from conventional equity benchmarks toward monetary metals and their related equities, driven by valuation resolution and long-cycle dynamics rather than short-term catalysts.
About MSA’s 360 weekend report


