
With Little Fanfare, Bullion-Bank Raises Silver to $85 in 3 Months (Gold to $5,000)
UBS says silver’s surge reflects physical deficits and policy risk, not financial excess. Export licensing in China and constrained mine supply are tightening markets, driving volatility. Gold continues to reprice on central-bank demand and macro uncertainty, with higher targets through 2026 before potential consolidation.
“The gold-silver ratio could drop to 30-50 (as in the 1970s-1980s), with silver price potentially reaching triple-digits.”
-UBS
Silver and Gold Enter a Tightening Phase Driven by Physical Constraints and Policy Risk
Silver market volatility is being reinforced by physical deficits and export controls, while gold continues to reprice on reserve demand and policy uncertainty.
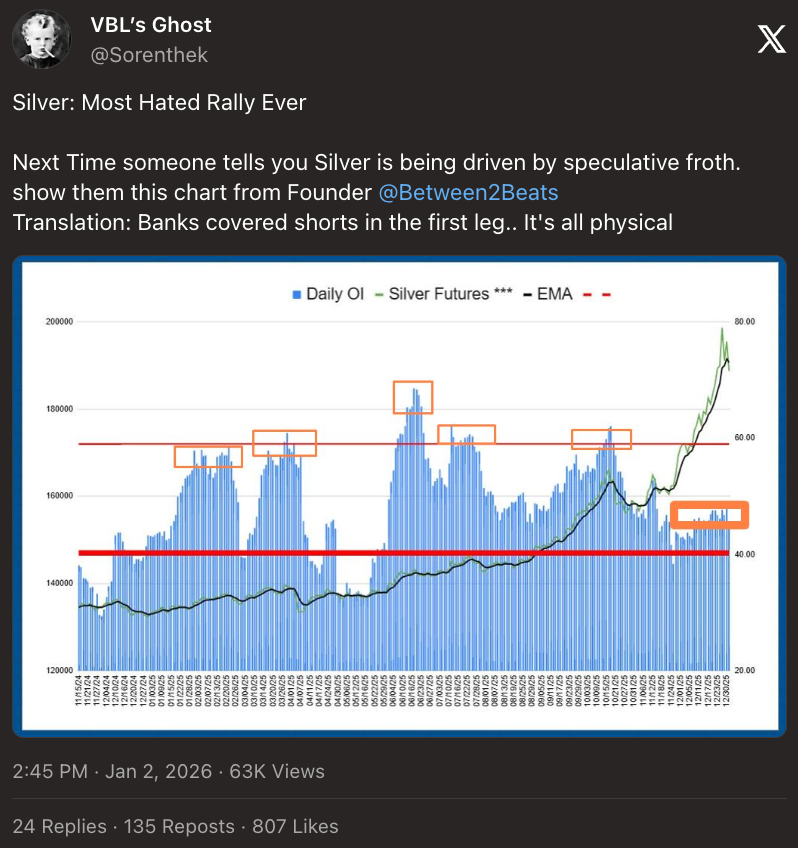
Silver Market Tightness Has Shifted From Financial to Physical
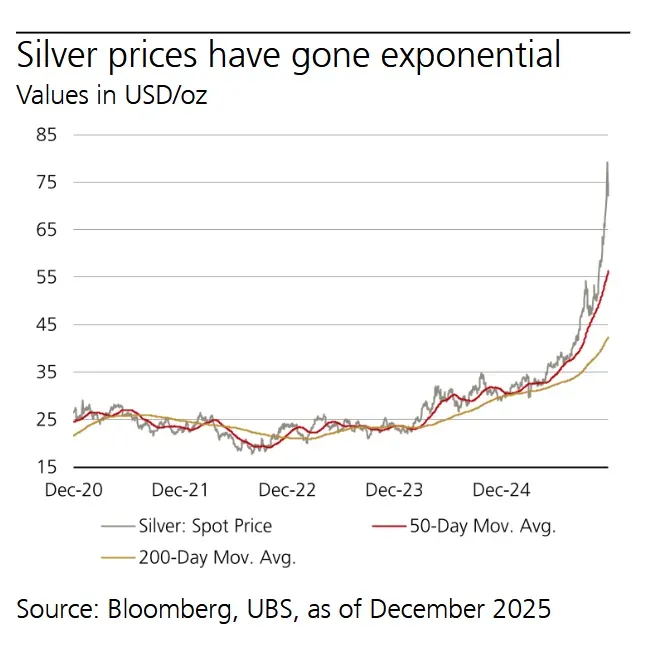
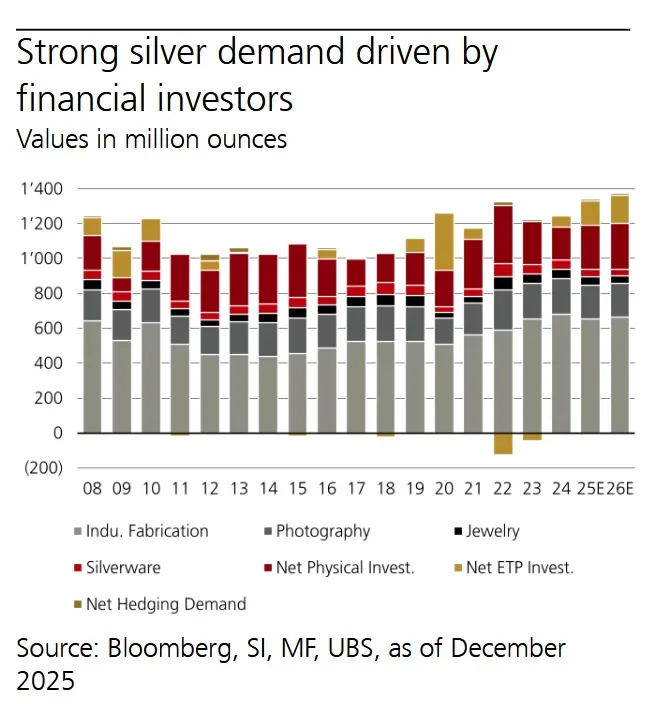
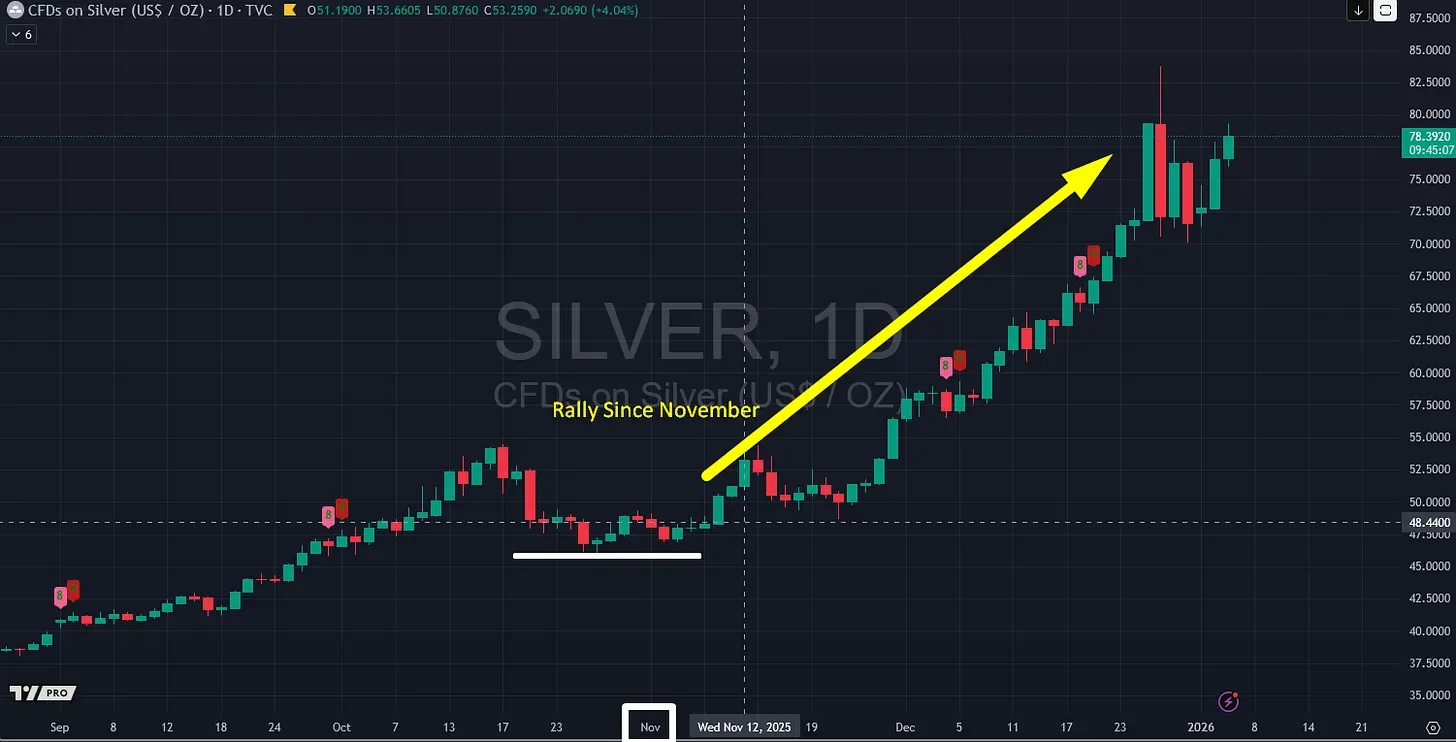
Silver prices experienced a sharp rally into year-end 2025, marking the strongest advance since the late 1970s. According to the report, this move reflects sustained investment demand, tightening physical availability, and forward curve signals consistent with shortages rather than speculative excess.
European markets have shown evidence of physical tightness through a downward-sloping forward curve, while China’s silver futures curve has flattened or inverted into year-end. These pricing structures align with market balance estimates that point to a substantial supply deficit.
“Sustained investment demand for precious metals throughout the year contributed to tighter market balances entering the fourth quarter.”
The report estimates a silver market deficit approaching 300 million ounces in 2025, with similar shortfalls expected in 2026.
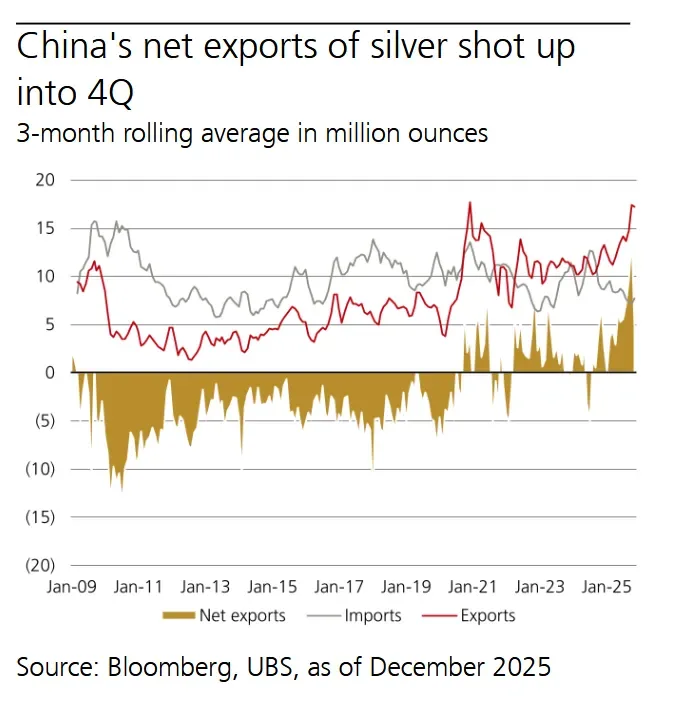
China’s Export Controls Introduce a New Supply Risk
Beginning 1 January 2026, China is expected to implement export licensing requirements for silver shipments. While the precise impact remains uncertain, the report highlights the scale of China’s historical role in global silver flows.
Over the past year, China exported approximately 13.8 million ounces of silver per month while importing 8.3 million ounces, resulting in a net export of 5.5 million ounces. More recent data show net exports rising to 9.3 million ounces per month, a material figure relative to global monthly supply of roughly 88 million ounces.
“Concerns about Chinese export restrictions beginning 1 January have exacerbated fears of shortages in an already global tight silver market.”
The introduction of export controls has coincided with heightened investor focus on supply security and contributed to rising volatility.
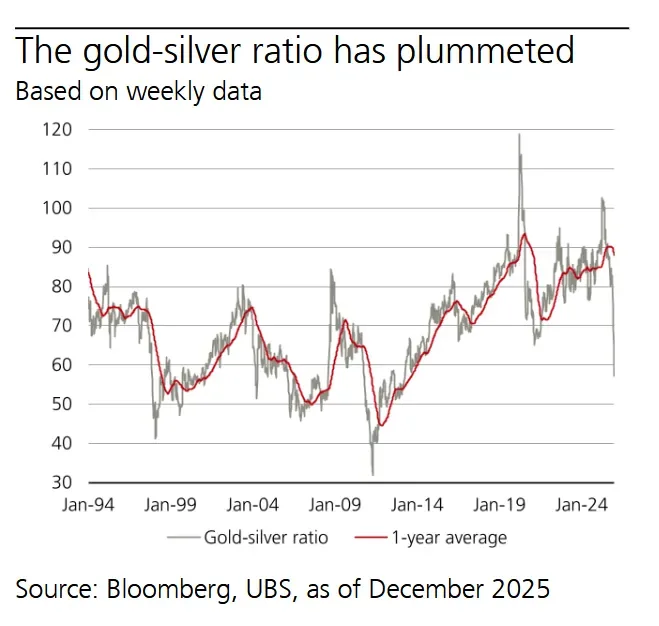
Gold-Silver Ratio Compression Reflects Relative Tightness
The report notes that the gold-silver ratio has fallen below 60 and, at times, under 55. While these levels do not represent historic extremes, they remain well below long-term averages.
Historically, the gold-silver ratio has averaged just over 80 during the past decade and approximately 65 over the last 50 years. The analysts argue that silver is no longer historically cheap relative to gold at current levels.
“Based on this data, we think silver is no longer historically cheap when compared to gold.”
Large declines in the ratio are described as uncommon and typically associated with discrete historical episodes rather than persistent structural shifts.
Industrial Demand Supports Silver but Does Not Fully Explain Shortfalls
The report identifies strong industrial demand as a supportive factor for silver, particularly from photovoltaics, electric vehicles, electronics, and potential battery applications. However, it emphasizes that industrial usage alone does not account for the scale of current market deficits.
Mining output growth remains constrained, and the analysts note that higher prices may be required to incentivize additional supply or substitution. At the same time, silver’s relatively small market size makes it more susceptible to self-reinforcing price movements during periods of tightness.
Silver Price Outlook for 2026 Emphasizes Volatility
UBS revised its silver outlook upward, reflecting ongoing supply risks and projected deficits. With a gold price target of USD 5,000 per ounce, the report forecasts silver trading around USD 85 per ounce in the short term before settling near USD 70 per ounce by the end of 2026.
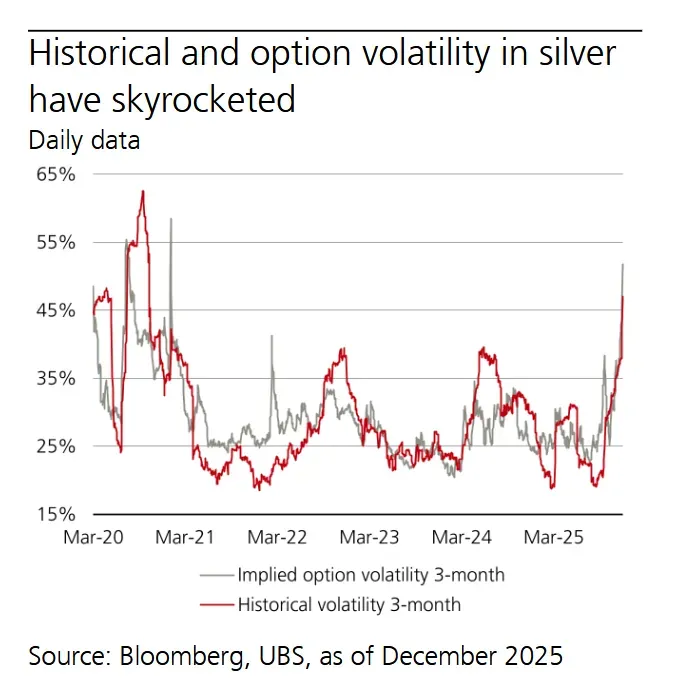
The analysts acknowledge elevated option volatility near 50 percent and note that silver’s historical behavior includes sharp rallies followed by meaningful retracements.
“Historically, silver has exhibited bubble tendencies and periods of low liquidity.”
Risks to the Silver Outlook Are Two-Sided
Upside risk exists if industrial demand materially exceeds expectations and fabrication demand shifts into deficit, a scenario that could compress the gold-silver ratio toward levels seen in the 1970s and 1980s. Under such conditions, silver prices could potentially reach triple-digit levels.
Downside risk includes the possibility of weaker industrial demand or declining inflation concerns, which could reduce investment flows. In such a scenario, the report suggests that a 50–75 percent retracement of the recent rally, toward approximately USD 55 per ounce, would be possible. Risk-off market conditions could also temporarily soften prices.
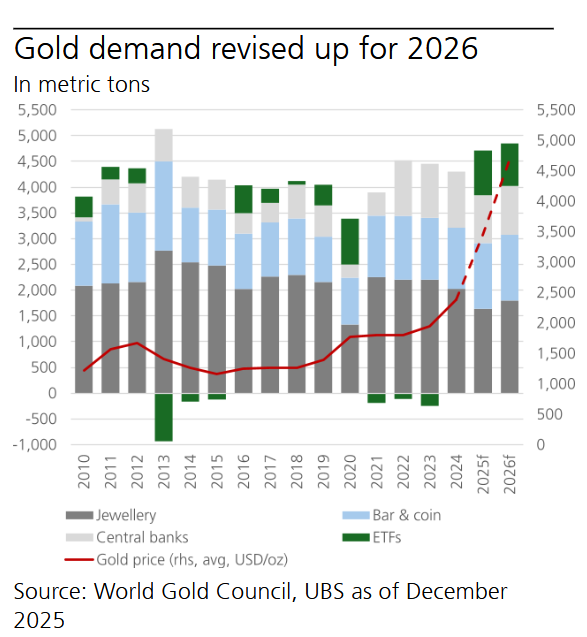
Gold Continues to Reprice on Policy and Reserve Demand
Gold reached new record highs in 2025, marking its strongest year since 1979. The report attributes this performance to a combination of US dollar weakness, heightened geopolitical tensions, institutional uncertainty, and strong official-sector demand.
“Gold has reached new record highs, driven by demand for real assets as the US dollar weakened.”
Central bank purchases are projected to reach 950 metric tons in 2026, exceeding prior forecasts. ETF inflows are also expected to remain elevated at 825 metric tons, more than double the annual average seen between 2010 and 2020.
Gold Price Outlook Anchored by Real Yields and Policy Risk
UBS raised its gold price target to USD 5,000 per ounce for March, June, and September 2026, with a projected moderation to USD 4,800 per ounce by year-end following the US midterm elections. The report notes that prices are trading at an elevated premium and could consolidate if monetary policy surprises or ETF outflows materialize.
Conversely, an escalation in political or financial risks could push prices higher, potentially toward USD 5,400 per ounce.
Forward Frame
Across both metals, the report emphasizes the interaction between physical supply constraints, policy decisions, and investment demand. For silver, export controls and persistent deficits underpin elevated volatility and tighter pricing. For gold, reserve accumulation and macro uncertainty continue to support a higher pricing regime through 2026, subject to policy and market risk conditions.


